Datastore Experience • Web
Data access shouldn’t feel like a bureaucratic maze. This project redesigned how teams request, approve, and manage data access while keeping governance and security intact.
/
/
Datastore Experience • Web

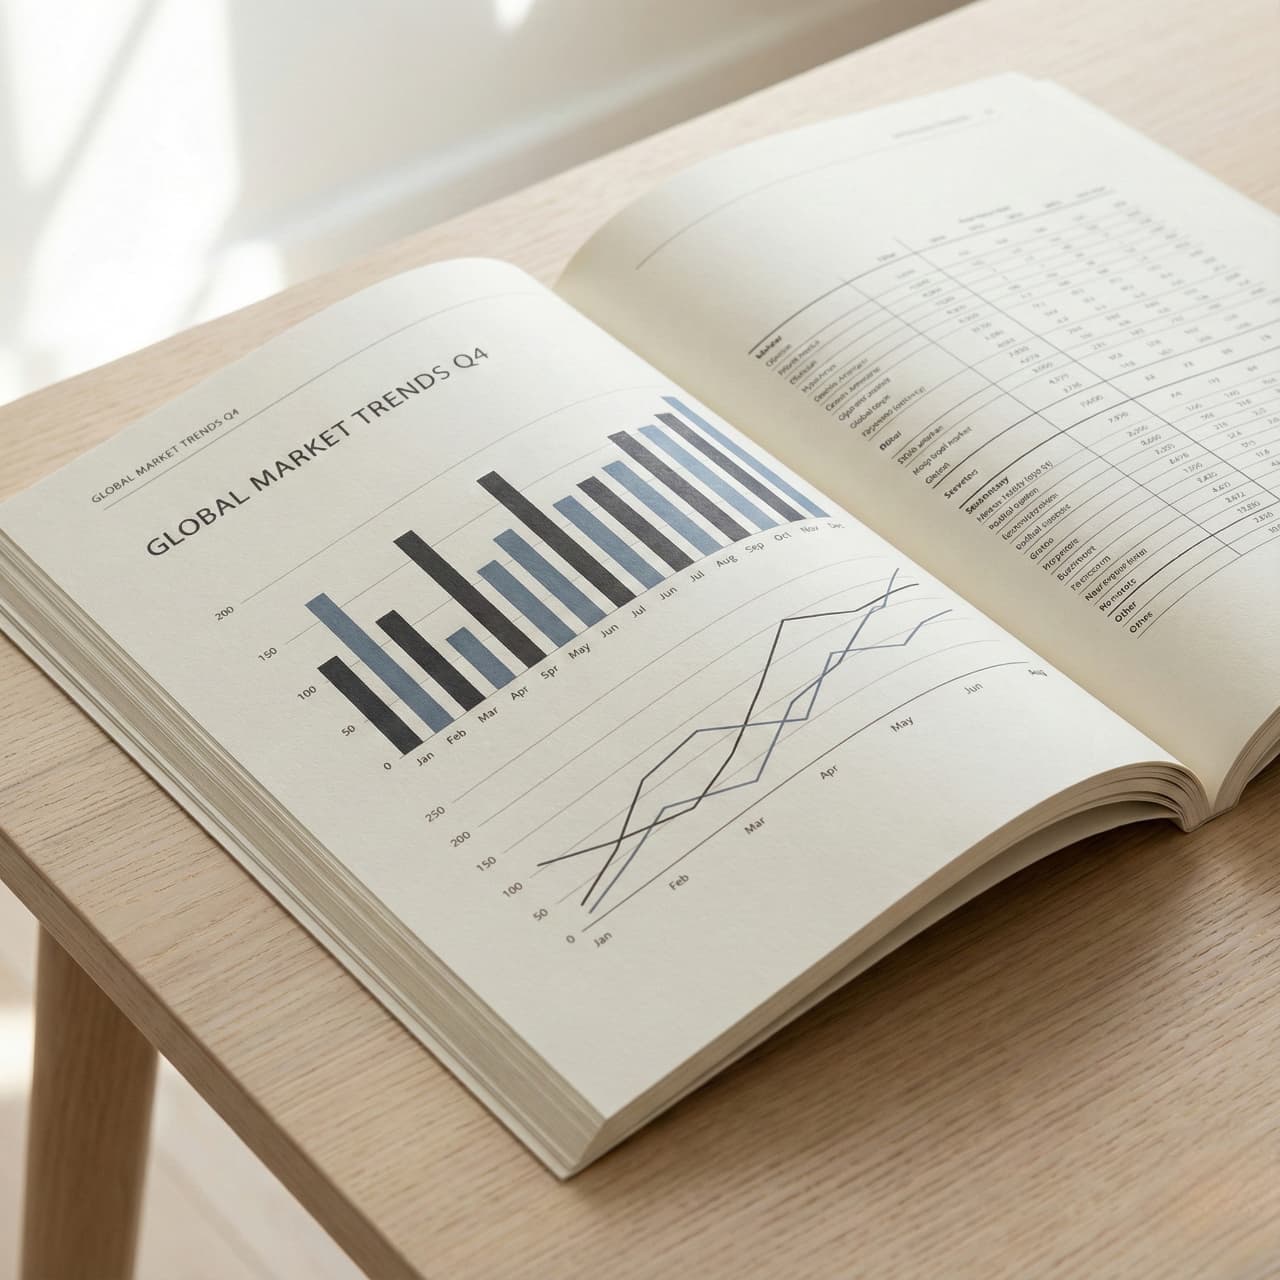
We paired a restrained typographic palette with functional color coding to guide readers. Infographics were built with simplicity in mind, ensuring comprehension without sacrificing style. The result is an annual report that feels modern, confident, and easy to navigate.